
From Clomosy Docs
The TClChart component is the basic building block for charts. You can use this component to add a graphic to your application on Clomosy.
AddNewChart(TComponent, xName, xTitle) : TClChart
TComponent : The variable name of the defined component is written. Here you should write the component variable name of whatever your component will be in.
xName : The name of the defined chart should be written.
xTitle : You can add a title.
Let's create a label.
1. Create a new project.
2. You need to define TClChart on the form. To do this, you should add under the var parameter on the ide as follows. It is the name of your variable you typed at the beginning. You should define this as you want and add it as TClChart.
var
 testChart : TClChart;
3. Add the TClChart to the form. For this, you must add the begin end block and add it inside the form after the form is defined. By saying MyForm.AddNewChart, we actually add to the form we have defined. Here, you need to add your form definition as whatever you wrote it.
testChart := MyForm.AddNewChart(MyForm,'testChart','Clomosy Inc');
4. If you do not want to define it in the form, you can add it in another component (such as Layout, Panel). Of course, before that, that component must be defined.
testLayout := MyForm.AddNewLayout(MyForm,'testLayout');
testChart := MyForm.AddNewChart(testLayout,'testChart','Clomosy Inc');
5. We gave the variable name while defining the TclChart in var. Now when you add this in begin end you should use this variable name in all definitions. Your code will throw an error when you write these variable names incorrectly.
6. Now let's design our TclChart component. Let's set the width and height first. For this, you must make the following definitions.
testChart.Height := 50;
testChart.Width := 150;
7. With the Align parameter, you can specify where you want our component to be aligned in the form. This parameter has multiple positioning properties. See the page to learn about these features. We're going to call it the top part here. So we have to write "AlTop".
testChart.Align := alTop;
8. With the Margins parameter, you can give margins at any scale from the right, left, bottom, top.
testChart.Margins.Left:= 50;
testChart.Margins.Right:= 50;
testChart.Margins.Top:= 50;
testChart.Margins.Bottom:= 10;

9. There are 2 different methods to add data to the TClChart component. With the json structure, data can be added or the data can be added by taking the data over the data set. Examples of these are given at the bottom of the page. Their identification procedures are as follows:
procedure clLoadDataFromJSONStr(JsonStr:String);
procedure clLoadDataFromDataset(SourceDS:TDataSet);
10. It has TClChart features. These are the chart title on the chart, the x-axis area given for the values to be compared, the chart item title, and the chart item values. Definitions:
XAxisText : String;
- The x-axis area given for the values to be compared
Use Of:
testChart.XAxisText := 'DeviceType';
ChartItemsValue : String;
- The values of the items entered on the X axis come and the graph is formed over these values.
Use Of:
testChart.ChartItemsValue := 'Percent';
ChartItemText : String;
- It is the title of graphic elements.
Use Of:
testChart.ChartItemText := 'Device Sales';
ChartTitle : String;
- The title of the chart.
Use Of:
testChart.ChartTitle := 'Samsoong Inc';
11. Now let's move on to the chart views. There are 4 graphic views available. The "TChartType" parameter is used to change the graphic display. Graph view properties definitions:
- clCLine : Line view.
- clCBar : It's a bar view.
- clCPie : It's a pie view.
- clCSizedPie : It is a sized pie view.
Use of:
testChart.Charttype := clCBar;
You can see their looks below.
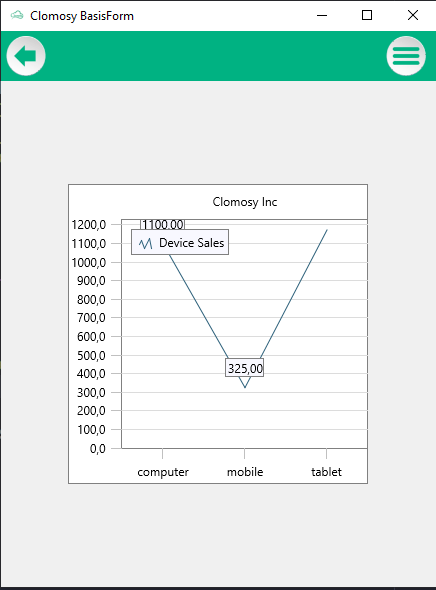
clCLine
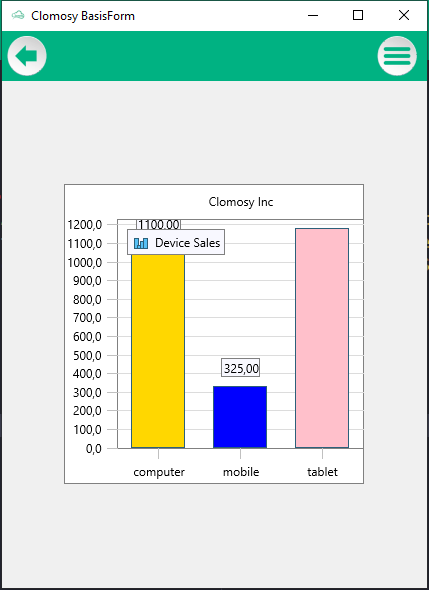
clCBar
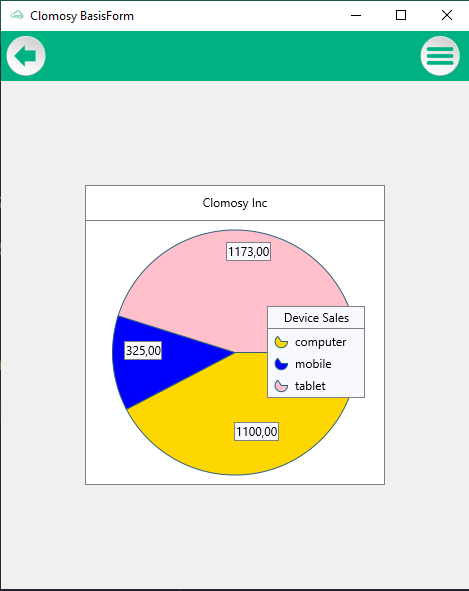
clCPie
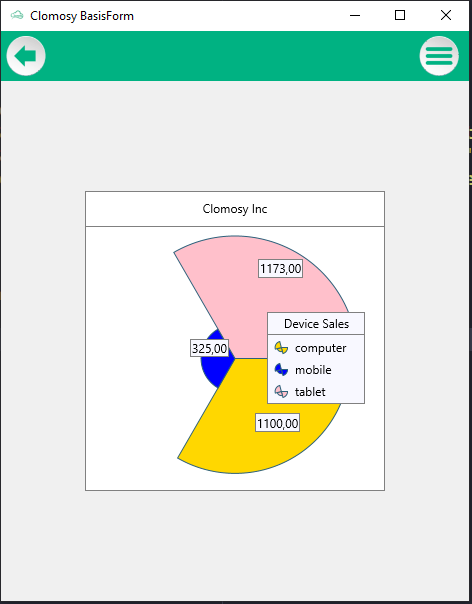
clCSizedPie


12. When you want to specify the colors of the values on the chart, you can color them by typing "color":"clOrange" as in the example.
simpleJSONStr := '[{ "DeviceType": "Notebook","Percent": 50,"color":"clOrange"}]';
Available colors:
Apart from this color, there are varieties of colors that you can give. These:
- clGreen
- clRed
- clYellow
- clBlue
- clYellowGreen
- clAzure
- clTomato
- clPurple
- clPink
- clGold
- clPeru
- clOrange
14. To tell you the truth, you have created a simple application that does nothing yet. Let's save and start using our project. You can save in one of two ways:
Click the save icon (the button in the upper right corner) or press Ctrl + S to save the project and see what you've done on the platforms now.
Now let's make an example with both the json structure and the dataset.
JSON Data Example
var
  MyForm:TFrmClomosyBasisForm;
  testChart : TClChart;
  simpleJSONStr : String;

begin
  MyForm := TFrmClomosyBasisForm.Create(Self);
  testChart := MyForm.AddNewChart(MyForm,'testChart','Samsoong');
  simpleJSONStr := '[{ "DeviceType": "Notebook","Percent": 50,"color":"clOrange"},{"DeviceType" : "Tablet","Percent": 35,"color":"clPink"},{"DeviceType" : "Phone","Percent": 73,"color":"clTomato"}]';

  testChart.Charttype := clCBar;
  testChart.XAxisText := 'DeviceType';
  testChart.ChartItemText := 'Device Sales';
  testChart.ChartItemsValue := 'Percent';
  testChart.ChartTitle := 'Samsoong Inc';
  testChart.clLoadDataFromJSONStr(simpleJSONStr);
  MyForm.Run;

end;
Output:

Data Set Example
Var
 MyForm:TFrmClomosyBasisForm;
 testListview : TClProListView;
 testDesignerPanel : TClProListViewDesignerPanel;
 MAIN_TEXT,myLabel : TClProLabel;
 ImgUrl : TClProImage;
 searchEdt : TClProSearchEdit;
 testButton : TclButton;
 testChart : TClChart;
 simpleJSONStr : String;
procedure SetupSqlConnection;
begin
   Clomosy.DBSQLServerConnect('SQL Server','server_name','user_name','user_password','database_name',port);
end;

procedure AddDataToListview;
Var
   foodListQuery : TClSqlQuery;
begin
   foodListQuery := TClSqlQuery.Create(nil);
   try
     foodListQuery.Connection := Clomosy.DBSQLServerConnection;
     foodListQuery.SQL.Text := 'SELECT SUM(sales_figure) AS SALES, case when device_type ='+QuotedStr('tablet')+'
     then '+QuotedStr('clPink')+' when device_type ='+QuotedStr('mobile')+' then '+QuotedStr('clBlue')+'
     else '+QuotedStr('clGold')+' end  as color ,  device_type FROM [ProductSales].[dbo].[OperatingSystem]
     GROUP BY device_type';
     foodListQuery.Open;
     if foodListQuery.Found then
     begin
       testChart := MyForm.AddNewChart(MyForm,'testChart','Clomosy Inc');
       testChart.Charttype := clCSizedPie;
       testChart.XAxisText := 'device_type';
       testChart.ChartItemText := 'Device Sales';
       testChart.ChartItemsValue := 'SALES';
       testChart.ChartTitle := 'Clomosy Inc';
       testChart.clLoadDataFromDataSet(foodListQuery);
     end;
    finally
    foodListQuery.Close;
      foodListQuery.Free;
    end;
end;

begin
   MyForm := TFrmClomosyBasisForm.Create(Self);
   SetupSqlConnection;
   AddDataToListview;

   MyForm.Run;

end;
Output:
